US Earthquake Threats and Risks
As with other pages, this one is a compilation of my blog posts related to the earthquake threat and risks in the United States.
Updated Sep 16 with the top earthquake risk states and cities.
U.S. Earthquake Threats and Risks
The largest earthquake on record was a magnitude 9.4-9.6 that struck in Valdivia, Chile, in 1960. Lists of largest earthquakes are generally only reliable since the early 1900s, when the use of scientific measuring equipment began to be used and records were kept.
Large earthquakes since the 1700s can have magnitudes reasonably deduced due to reports of the earthquake. However, if nobody was around to feel or record it, did it really happen?
Joking aside, the reality is there have been many extremely large and destructive earthquakes that we don’t have records for, or which were not adequately recorded. Except for digging trenches and examining the geologic record, we don’t have much historical records for determining size and frequency.
None of the notable earthquakes previously discussed were in North America. That doesn’t mean there isn’t a high risk in the United States.
First, let’s look at the mega-quakes from around the world.
The Wikipedia website has a list of the top 36 largest earthquakes in the world. The largest quake registered was as high as 9.6, with the bottom of the list being 15 magnitude 8.5 earthquakes. The earliest quake listed was in 1575, and the most recent (as of this writing) being in 2012.
Of those quakes, one was listed in the sixteenth century, and three for the seventeenth century. Nine occurred in the eighteenth century. Seven happened in the nineteenth century. Ten were recorded through the twentieth century. For the twenty-first century we have already had six, and we haven’t even gotten out of the second decade.

Earthquake Threats over the Last Century
While there may not be accurate records for past mega-quakes, it would appear, at least over the last few centuries, that we are in an upward trajectory and can expect more mega-quakes.
Of the 36 earthquakes, only four occurred in the United States, with three of those in Alaska. The only non-Alaska quake was the Cascadia rupture on January 26, 1700, that had an estimated magnitude range of 8.7 to 9.2. The December 16, 1811, rupture on the New Madrid fault in Missouri didn’t even make the list with its mere 8.1 magnitude.
While North America hasn’t put in high ranking earthquake numbers, it’s not like the earth is quiet.
Since the January 26, 1700, Cascadia earthquake there have been more than 40 earthquakes of magnitude 6.5 or higher that rocked different areas of the United States. Seven of those happened in the 1800’s. A whopping 23 occurred in the 1900’s. From 2000 to July 5, 2019, there were ten magnitude 6.5 or higher quakes.
During the twentieth century, the first three decades saw only one of these 6.5 or larger earthquakes per decade. The 1930’s didn’t have any. Then three happened in the 40’s, four more in the 50’s, and three in each of the decades from the 60’s to 80’s. Five more happened in the 90’s.
In the first decade of the 21st century, four more magnitude 6.5 quakes shook areas of Alaska and California. have happened in the first decade of the new century. Nine and a half years into the second decade has already seen six more.

Rising Earthquake Threats?
Staying in the United States, when we look at magnitude 7.0 and larger, there was one in the 1700’s and four in the 1800’s. It’s very likely there could have been more, but we don’t have any record of them.
The 1900’s saw 14 of these large earthquakes, with one in each of the first two decades, and none in the 20’s and 30’s. There was one in the 40’s (a monstrous 8.6 in Alaska), four in the 50’s (including another 8.6 in Alaska), two in the 60’s (one was a devasting 9.2 in Alaska), and another two in the 70’s. Only one magnitude 7.0 or larger happened in the 80’s, and another two happened in the 90’s.
The U.S. had a 7.9-magnitude quake strike Alaska during the first decade of this century. However, there have been five of magnitude 7.0 or greater during the first nine and a half years of the second decade, with four of those in Alaska.
The following table shows the number of magnitude 7.0 or larger earthquakes per time period. Note that the 18th and 19th centuries have their own rows, while the 20th and 21st centuries are divided into decades. The data used to compile this table was for my book that was completed in fall 2019.

If you didn’t notice, Alaska is the most earthquake prone state. However, earthquakes in the Last Frontier state seldom make the news as there isn’t the damage and destruction that would make them newsworthy.
Looking at the numbers, it appears that the frequency of large earthquakes is increasing.
When we look into regions more closely, you will discover that big earthquakes are overdue in each region, with “big” being a magnitude 7.0 or greater rupture.
Something I mention in chapter 4 of my book, which is starting to be discovered through studies, is a big earthquake in one area could trigger earthquakes in another. This triggering could either come within a very short time following the first earthquake. Or, the first earthquake could result in increasing stresses on other faults and raise the likelihood of a big earthquake happening on those faults in the near future.
Earthquake Risks in the US
In 2018, the U.S. Geological Survey (USGS) released a report that found 42 of the 50 states have a reasonable chance of experiencing a damaging earthquake over the next 50 years. With the report, they released an updated hazard risk map. The following image is the Simplified 2018 long-term risk map for earthquakes in the United States over the next 50 years. There are more recent short-term risk hazard maps, but as of this writing, the 2018 is the most recent long-term map. As indicated by the colored legend, pink, red, and orange have the higher risk for earthquake damage.
The following hazard map is from the USGS and is in the public domain. Regarding the hazard map, the USGS states:
"Earthquake hazard map showing peak ground accelerations having a 2 percent probability of being exceeded in 50 years, for a firm rock site. The map is based on the most recent USGS models for the conterminous U.S. (2018), Hawaii (1998), and Alaska (2007). The models are based on seismicity and fault-slip rates, and take into account the frequency of earthquakes of various magnitudes. Locally, the hazard may be greater than shown, because site geology may amplify ground motions."
Hazard map is at from https://www.usgs.gov/media/images/2018-long-term-national-seismic-hazard-map

Earthquake Risk and Hazard
Eastern Regional Earthquake Risk in the U.S.
The eastern earthquake risk in the United States may not be as high as other regions, but it still exists. On August 9, 2020, a magnitude 5.1 earthquake struck two miles southeast of Sparta, North Carolina. It was the largest to hit the region since a 5.2 in the Great Smoky Mountains in 1916. It was strong enough to shake off items from store and home shelves, but there were no deaths or injuries reported. At least four foreshocks of magnitudes 2.1 to 2.6 occurred in the preceding 25 hours.
Earthquake Risk on the East
In 2011, a magnitude 5.8 earthquake struck central Virginia. It was an unexpected tremor, and the strongest to hit the eastern United States since 1897. People felt the quake from Florida to southeastern Canada, and as far west as Wisconsin. Some estimated almost a third of the U.S. population felt it. One reason it was believed to be felt over such a wide area is the underlying ground structure, where the type, age, density, and even temperature or the underlying rocks of the eastern United States transmit seismic waves more efficiently than in the western states.
Analysis of the quake indicates that the eastern U.S. cities are at a greater risk of being affected by earthquakes than previously estimated. It was also noticed that “an unusually high fraction of the seismic energy radiating from [the 2011] quake was directed towards the northeast, where several major population centers lie, along the network of faults in the region” ( Virginia earthquake wins by a landslide).
Earthquakes in the eastern region of the United States are felt more widely than those on the west because the seismic waves travel through the colder, denser crust much further. The following image is public domain, retrieved from https://www.usgs.gov/media/images/central-virginia-earthquake-comparison-map

There is sufficient documented evidence to suggest the need to revise the established distance limits for the occurrence of landslides in different tectonic environments
Rockfalls and landslides from the M5.8 quake were triggered “at distances four times greater and over an area 20 times larger than previously documented for M-5.8 earthquakes worldwide” (2011 Virginia quake triggered landslides at extraordinary distances). Previous studies estimated a quake of that size should only trigger landslides up to 37 miles (60 kilometers) away. But, that quake set records by causing landslides at least 152 miles (245 km) away. In the linked article the two USGS authors (Randall W. Jibson and Edwin L. Harp) state, "There is sufficient documented evidence to suggest the need to revise the established distance limits for the occurrence of landslides in different tectonic environments."

Largest Eastern U.S. Earthquake
The largest recorded earthquake on the east coast was an estimated 6.9 to 7.3-magnitude tremor that occurred in 1886, striking Charleston, South Carolina, and killing at least 60.
In 1755, an estimated 6.0 quake hit Boston. A magnitude 6 struck Cape Ann, Massachusetts, in 1755.
A 5.0 in 1737 and 5.3 in 1884 struck near New York City. More recently, a 5.8 tremor rocked the northern part of New York in 1944.
While these magnitudes aren’t really large earthquakes, they can cause significant damage particularly to older buildings. In both Boston and New York City there are many structures built with unreinforced masonry. While New York City is built mostly on bedrock, Boston has it worse where much of the city is built on artificial fill, which can amplify seismic waves by as much as three times (Background on: Earthquake insurance and risk).
Eastern Seismic Zones
Like the central U.S., the east has seismic zones. Some of these include the East Tennessee, Central Virginia, and Charleston/South Carolina Seismic Zones.
The issue with earthquakes in the eastern U.S. is their rarity. The problem with establishing a historical record is our record only goes back about 400 years. Accurate measurements of earthquakes only go back about 100 years. So, our knowledge about east coast quakes comes from large events that were noticed, and recorded, by people in the area.
Unlike the west coast, there aren’t active tectonic events such as subduction zones, collisions or spreading in eastern North America. Where faults in California might have recurrences measured in decades or centuries, we don’t know the intervals on the east. There may be thousands, hundreds of thousands, or even millions of years between major events (Are Big Earthquakes a Concern for the Eastern United States?).
What if a big earthquake, even in the mid-to-upper magnitude 6-range struck? Considering the aging infrastructure and many structures not built to be seismically resilient, there could potentially be enormous destruction. The 1866 earthquake in Charleston did not have any previously known earthquakes in the region.
Like many other parts of the country, residents on the east coast need to become better prepared. Many should be prepared for hurricanes (although most are not), and it’s not much more of a step to become prepared for an earthquake.
The following image is of the Central Virginia Seismic Zone. Red circles indicate epicenters of quakes since 1973 and some notable earlier quakes.

Central Regional Earthquake Risk in the U.S.
December 16, 1811, residents of the small town of New Madrid, Missouri, where awakened by the roar and violent shaking of a large earthquake. It was the first of three large quakes, estimated to be between magnitude 7.5 and 8.0, that shook the area over two months, the last large one striking February 7, 1812. Some sources estimate the highest magnitudes to be 8.7 to 9.2.
Residents of the area reported cracks opening, the ground rolling in visible waves, and large areas of ground rose or sunk. Locations as far away as Charleston, South Carolina, and Washington, D.C. reported damage (New Madrid Seismic Zone). The December 1811 quake “rang church bells in Boston, Massachusetts, 1,000 miles away” (Insurance Information Institute, Background on: Earthquake insurance and risk). There were reports of the Mississippi River flooding, and even running backwards in some locations (Arkansas Department of Emergency Management, Earthquake). Other accounts saw the river rise “like a great loaf of bread to the height of many feet,” and fissures opening with geysers of sand, water, mud, and coal (The Great Midwest Earthquake of 1811).
The following image is an isoseismal map depicting estimated earthquake intensities throughout the central and eastern United States of the December 16, 1811 earthquake that struck at 08:15 UTC. Image is public domain, retrieved from https://www.usgs.gov/media/images/1811-1812-new-madrid-earthquakes-isoseismal-map, abridged from Seismicity of the United States, 1568-1989 (Revised), by Carl W. Stover and Jerry L. Coffman, U.S. Geological Survey Professional Paper 1527, United States Government Printing Office, Washington: 1993.

Biggest Central Earthquake Risk
The biggest threat to the Central U.S. is from the New Madrid Fault Zone. It stretches along the central Mississippi valley, extending from northeastern Arkansas to southeastern Missouri, out to western Tennessee, then Kentucky, and up to Illinois.
Until a few decades ago, geologists assumed the 1811-12 ruptures were one-time events. Excavations of sand blows have discovered evidence of previous large earthquakes. Outside of the seismic zone other faults have been discovered including near Memphis, Tennessee, Commerce, Missouri, and in other places. All of the faults have evidence of having been active in the past few thousand to millions of years. As a result, scientists have warned these quakes were not freak occurrences.
The biggest threat to the Central U.S. is from the New Madrid Fault Zone
Back in 1811 the population in St. Louis was 5,700. Now there are 11-12 million people in the St. Louis-Memphis region. With damage occurring over 232,000 square miles in the 1811-12 earthquakes, a similar event today would have catastrophic consequences.
Unlike the ground on the west coast, earthquakes in central and eastern states are felt over much larger areas. This is due to the geology of the area, where the softer soils allow for the seismic waves to travel further.
Central Earthquake Risk - New Madrid Seismic Zone
East of the Rocky Mountains, the New Madrid Seismic Zone is the most seismically active area. Over the next 50 years, there is a 7-10 percent probability of a magnitude 7.0 or larger earthquake. The likelihood of a 6.0 or larger is between 28 and 46 percent (Arkansas Department of Emergency Management, Earthquake).
From seismic activity, geologists have also learned there are several thrust faults are in the area, from Marked Tree, Arkansas, to Cairo, Illinois. Unlike the west, where many faults are visible, faults in the central (and eastern) U.S. are buried deep. Not knowing exactly where the faults are, they are categorized as seismic (or fault) zones. Besides the New Madrid zone, the Wabash Valley Seismic Zone can also produce damaging earthquakes.
More information about the potential damage from a large earthquake in the New Madrid Seismic Zone can be found under the various states and cities in that area in my book. I'll also be posting that information in the future.
The following image shows the New Madrid and Wabash Valley Seismic Zones as the orange patches. The red circles are magnitude 2.5 or larger earthquakes that occurred from 1974 to 2002. Green circles are earthquakes prior to 1974. The larger the circle, the bigger the quake. Image from USGS, public domain, from https://www.usgs.gov/media/images/map-new-madrid-seismic-zone

Central Earthquake Risk - Wabash Valley Seismic Zone
North of the New Madrid Seismic Zone, in Southeastern Illinois and Southwestern Indiana, is the Wabash Valley Seismic Zone. On April 18, 2008, a magnitude 5.2 quake hit near Mt. Carmel, Illinois, and it was felt in at least 16 states. There were no injuries or fatalities, but it demonstrated the area is at risk for earthquakes. A smaller, magnitude 4.6, quake occurred several years earlier, on June 18, 2002 near Evansville, Indiana.
The Wabash Valley Seismic Zone is capable of magnitude 7.0 earthquakes. Geologists have found prehistoric evidence of liquefaction and sand dikes, and an estimated magnitude 7.1 earthquake created one formation. If a similar event happened today, there’d be widespread damage and destruction.
Western Regional Earthquake Risk
The entire west coast is at high risk for earthquakes. The Insurance Information Institute lists the ten costliest earthquakes in the United States from 1906 through 2018. Of those, six were in California (Facts + Statistics: Earthquakes and tsunamis.).
Earthquake Risks in the West
Two other quakes on that list were also on the western end of North America. One quake was a magnitude 6.8 rupture that struck Nisqually, Washington, on February 28, 2001. A magnitude 7.1 shook Anchorage, Alaska, on November 30, 2018.
Of the remaining two costliest earthquakes in the U.S., one was a 6.7 rupture on October 15, 2006, in Kiholo Bay, Hawaii. The other was a much smaller, magnitude 5.8 tremor that rocked the Piedmont region of Virginia on August 23, 2011.
Returning to the west coast, the USGS puts the probability at 60 percent that a magnitude 6.7 or greater earthquake will strike the Los Angeles area within the next 30 years. Probabilities for magnitude 7 and 7.5 ruptures are at 46 and 31 percent, respectively.
Magnitude Probability
6.7 60%
7.0 46%
7.5 31%
For the San Francisco area, the USGS projects a 72 percent probability of a magnitude 6.7 or higher hitting the region. There’s a 51 percent chance of a magnitude 7 tremor, and only a 20 percent probability of a 7.5 or larger rupture
Magnitude Probability
6.7 72%
7.0 51%
7.5 20%
Increasing Western Earthquake Risk
The largest earthquake to strike the U.S. was a 9.2 tremblor that hit Alaska in 1964. Damage from the quake and tsunami was estimated to cost more than $500 million. But, while it was the largest, it didn’t come with the biggest price tag.
The January 17, 1994, Northridge California, earthquake was the costliest, with insured losses estimated at $26.373 billion in 2018 dollars (Facts + Statistics: Earthquakes and tsunamis). Incidentally, “the Northridge earthquake occurred on a previously unrecognized fault” (UCERF3: A new earthquake forecast for California's complex fault system).
Incidentally, if the 1906 magnitude 7.9 earthquake in San Francisco were to happen today, insured loses would probably exceed $105 billion (Background on: Earthquake insurance and risk).
Regarding the major faults in California, geophysicist Glenn Biasi and paleoseismologist Katherine Scharer analyzed seismic records going back 1,000 years on the five major faults in California: the northern San Andreas Fault, the Hayward Fault, the southern San Andreas Fault, the San Jacinto Fault, and the southernmost San Andreas Fault.
All together the faults span from north of San Francisco to the Mexico border. What they found is while a single fault might have a 100-year quiet period, the fact that all five have been quiet for over 100 years is unprecedented. Their research showed an average of three or four ground-rupturing quakes each century. Neither the 1989 Loma Prieta quake in the Bay Area, nor the 1994 Northridge earthquake were ground rupturing. Why the faults are quieter than average isn’t known. One possibility is there is something unknown “synchronizing the activity across these five major faults” (California's Eerie 'Earthquake Pause' Is Unprecedented).

Another possibility is the higher than average period from 1800 to 1900, where there were six ground-rupturing earthquakes. Those plus two more in the early 1900s, the 7.9-magnitude 1906 Great San Francisco Earthquake and a 6.7 on the San Jacinto Fault in 1918, may have released more seismic tension where the faults need more time to build up stress.
Moving north, the Cascadia fault, known also as the Cascadia subduction zone, had its last major earthquake in 1700, with a magnitude range of 8.7 to 9.2. Research presented at the May 2018 annual meeting of the Seismological Society of America suggests that the time frame between the megathrust events in the Cascadia subduction zone may be 200 years shorter that previously reported.
The geologic record suggests megathrust earthquakes, along with tsunamis, occurring about every 500 years. However, new research indicates that the southern part of the fault zone may only have a 300-year frequency (The Next Cascadian Megaquake May Be Sooner Than You Think). With the revised estimate, and the last megaquake in 1700, the next one may be due soon.
The Top 16 Earthquake Risk States
The top earthquake risk states fluctuates slightly from year to year, and from source to source. In most lists the top five earthquake risk states in the U.S., Alaska, California, Hawaii, Nevada, and Washington top the list.
The next three in this list--Wyoming, Idaho, and Montana--are around the Yellowstone area and northern end of the Wasatch Fault Seismic Zone. Again, rankings will fluctuate.
Utah and Oregon could easily go up in risk ranking, but for this site they place 9th and 10th.
The final six states have their major earthquake threat from the New Madrid Seismic Zone.
As you look at the USGS earthquake hazard map note one thing: There are few states that have no earthquake risk. This top earthquake risk list just focuses on those states with the highest risks.
Alaska
Alaska is the most seismically active region in the United States. But the lower population means there isn’t as much devastation to report.

Southern Alaska is near the Alaska-Aleutian Megathrust Fault Zone, which is one of the most active and dangerous on Earth.
On average, since 1900, Alaska experiences a magnitude 8.0 or larger earthquake every 13 years. The following shows how many earthquakes (on average) and their corresponding magnitudes the state experiences every year.
Magnitude range # tremors
7.0–7.9 1
6.0–6.9 6
5.0–5.9 45
4.0–4.9 320
California

Hawaii
Nevada
Washington
States generally ranked as the sixth through eighth highest earthquake risks are Wyoming, Idaho, and Montana.

Wyoming
Earthquakes have occurred in every county of Wyoming. However, the most seismically active area is the northwest region, where Yellowstone National Park is located. Historical records indicate that earthquakes as strong a magnitude 6.5 are possible in most parts of the state. Several faults in western Wyoming are capable of magnitude 7.2 to 7.5 ruptures, including the Teton Fault, Star Valley Fault, Greys River Fault, Rock Creek Fault, and Bear River Fault. Recent studies have led researchers to conclude that many of these fault systems are past due for big quakes.
The largest recorded earthquake in Wyoming occurred on August 18, 1959, in Yellowstone National Park. It was a magnitude 6.5 event and was considered an aftershock of the magnitude 7.2 Hebgen Lake earthquake that struck southwestern Montana the night before.
Despite the headline grabbing attention of the threat of the Yellowstone supervolcano, or another volcanic eruption in the area, the reality is, a large earthquake poses a higher risk to the area.
Idaho
On the morning of October 28, 1983, a magnitude 6.9 earthquake shook Central Idaho at Borah Peak. It was the largest quake to strike Idaho in recent history. Like any major tremor, aftershocks rattled the area for months afterwards, including a 5.4 quake. Two children died as a result of falling masonry while they were walking to school. While 200 homes received minor to moderate damage, 39 houses and 11 commercial buildings had major damage.
In August 1959, the southeastern corner of the state experienced the magnitude 7.2 Hebgen Lake, Montana, earthquake.
The area near the city of Soda Springs, in southeastern Idaho, experienced an earthquake swarm in September 2017. The largest of the tremors was a moderate 5.3, but it was enough to make the few in the area wary of a bigger one. The nearby Eastern Bear Lake Fault could rupture in the future with a magnitude 7.3 earthquake, although the U.S. Geological Survey estimates a 63 percent chance of a magnitude 6.0 or larger earthquake to hit the area within 50 years.
Should a large earthquake hit a small, rural community, the area could potentially become isolated with the destruction of roads, bridges, cell and radio towers, and electrical power transmission lines.
Montana
A magnitude 7.2 earthquake, named the Hebgen Lake earthquake, struck southwestern Montana on August 17, 1959. The earthquake was the deadliest and strongest on record to strike Montana. The tremor killed 28 and caused a huge landslide that blocked the Madison River and created Quake Lake, which is five miles long and a third of a mile wide.

The second largest quake in Montana’s recent history was a magnitude 6.2 that hit near Helena on October 18, 1935. A large aftershock of magnitude 6.0 struck on October 31. Those two quakes killed four people. Before the October 18 main shock, a small foreshock happened on October 3, and a more damaging 5.9 foreshock occurred on October 12.
Helena is at the northern end of the Intermountain Seismic Belt, which is an area of seismic risk that runs from northwestern Arizona through Utah and Idaho and into Montana. Near Helena is the Lewis and Clark Fault Zone, which typically has west-northwest trending faults.
If a magnitude 6.3 earthquake were to strike the Helena area today, it would likely result in over $500 million in property damage. North of the city, where the water table is high and alluvial soil is common, damage would likely result from liquefaction.
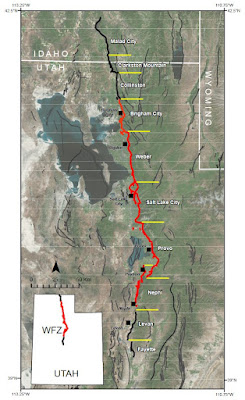
Utah
Easily ranked in the top 10 states with the highest earthquake risk, Utah's primarily risk lies among the Wasatch Fault Zone.
The following image is of a building damaged in the February 2011 Christchurch earthquake in New Zealand. There have been several comparative studies done between New Zealand buildings damaged by earthquakes and similar structures in Utah.

The Wasatch Fault Zone stretches about 240 miles from southern Idaho into northern Utah. While it is the longest fault zone in the area, it’s not the only one. Other large fault zones in the area include the Oquirrh-Great Salt Lake, West Cache, Stansbury, and Eastern Bear Lake fault zones.
The Wasatch Fault is at the base of the mountain range that runs through the state. Along the urban corridor, this section of the mountains is referred to as the Wasatch Front. With many communities built along the foothills, a major seismic rupture could not only cause a lot of liquefaction damage in the lowlands but hundreds of rockslides that could cascade into neighborhoods.
Running north-south along the Wasatch Fault is the main transportation artery, Interstate-15. Interstate-80 runs east-west through the Salt Lake Valley. A large earthquake would virtually shut down most transportation into and through the area.
Throughout Utah, there are more than 200 active faults, and many of these can produce ruptures of magnitude 6.5 to 7.5. While the Wasatch Fault tends to receive the most attention, and it has the highest risk, Utah’s high earthquake risk area extends from the Idaho border on the north down to the Arizona and Nevada borders. Over 95 percent of Utah’s population live within this high-risk zone (Utah's Earthquake Risk?).
With nearly 80 percent of Utah’s population living and working within fifteen miles of the Wasatch Fault and about 75 percent of the state’s economy also in the same area, combined with a large number of buildings susceptible to earthquake damage, there is a very high risk of economic and property loss in the event of a large earthquake.
A 2016 report estimated the probability of a magnitude 6.75 or higher earthquake in the next 50 years at 43 percent, which is much higher than earthquake experts had expected. The Wasatch Fault itself has an 18 percent probability, with other fault zones adding the extra 25 percent risk (Working Group on Utah Earthquake Probabilities, 2016).
In the event of a 7.0-magnitude tremor, it’s estimated that as many as 1 in 3 homes, about 76,000 single-family houses, in Salt Lake County are at risk of major damage or collapse. But residences aren’t the only buildings at risk. In some of the older, historic districts, as many as 9 in 10 brick-and-mortar buildings are built with unreinforced masonry (URM) and are high risk (1 in 3 Salt Lake County homes at greater risk of crumbling in earthquake). Throughout Utah, over 200,000 buildings are constructed with URM, and about 25 percent of the population work, go to school, or live in these buildings. As a comparison, California has about 25,000 URM buildings. These URMs pose a great hazard, and it’s estimated that up to 90 percent of the deaths and injuries in Utah’s next major earthquake will be from damaged or collapsed URMs (My Risk? Every Utahn should know).
In recent recorded history, the two largest earthquakes in Utah were a magnitude 6.6 in Hansel Valley in 1934, and a 6.5-magnitude quake in the town of Richfield in 1901. Two other quakes, although not as large, have occurred since then: a magnitude 5.7 earthquake hit Richmond in 1962, and a 5.8 shook St. George in 1992. These last two smaller-magnitude quakes actually caused more damage (Earthquakes & Utah).
Oregon
Like Washington, the greatest threat to Oregon lies in the Cascadia Subduction Zone. A magnitude 9.0 Cascadia event would likely cause damage to 38 percent of the buildings in Portland. In this scenario, tens of thousands could be injured or killed, while more than 250,000 could experience long-term displacement. Building damages could range from $23.5 billion to $36.7 billion as a result of the event (Open-File Report O-18-02, Earthquake regional impact analysis for Clackamas, Multnomah, and Washington counties, Oregon).

But a Cascadia earthquake may not even be the worst-case scenario. Stretching from Oregon City to Scappoose lies the 30-mile-long Portland Hills Fault. Estimates of a large quake striking that fault are less than the Cascadia Subduction Zone, but it would be more devastating. The Portland Hills Fault is estimated to have only had two large seismic events during the last 15,000 years. Still, if a large earthquake were to hit, its devastation could be far worse than a Cascadia rupture.
A magnitude 6.8 event on the Portland Hills Fault could cause more than $83 billion in building damages, which is more than double the high estimate of a 9.0 Cascadia rupture. The building loss ratio could be as high as 32 percent. The number of people displaced from the earthquake and its aftermath might be more than a quarter million of the population. The amount of debris generated from the quake may exceed 33 million tons. Depending on whether the earthquake occurs at night or in the day, total casualties could range from 29,000 to 63,000, respectively. Casualty estimates include everything from minor injuries to fatalities.
Like other places, the time of the year can be a factor in the effects of an earthquake. For example, when the soil is saturated, like during the winter months, the area is more prone to landslides and could result in worse damage than an earthquake in a dry summer. Similarly, earthquakes at night, when most people are home, are less likely to cause a lot of injury when compared to a day-quake where more people are out and about.
Another consideration to account for in gauging the effects of an Oregon earthquake is the high risk for liquefaction or landslides in certain areas, particularly if the soil is saturated. These areas would include a large portion of Portland’s west side, some parts of the city’s inner east side, and long stretches along the Columbia River.
For the central and northern Oregon coast, experts put the probability of a large earthquake between 15 and 20 percent in the next 50 years (When the 'Big One' hits, Portland faces mass casualties, widespread destruction: Study.).
For more information on earthquakes in the Pacific Northwest check out Oregon State University's ebook, Living With Earthquakes In The Pacific Northwest: A Survivor's Guide, by Robert S. Yeats. It can be downloaded from the linked page or viewed online beginning at the copyright page. The book is licensed on a Creative Commons Attribution-NonCommercial-ShareAlike license.
States #11-16
Rounding out the top 16 states in the U.S. with the highest earthquake risks are Arkansas, Illinois, Kentucky, Missouri, South Carolina, and Tennessee. The biggest threat to these states is the New Madrid Seismic Zone.

Arkansas
The biggest earthquake risk in Arkansas lies in the New Madrid Seismic Zone. The 19 counties in northeast Arkansas, those that stretch out from the Seismic Zone, are at greatest risk.
A magnitude 7.7 New Madrid earthquake would likely damage 162,000 buildings and 1,100 bridges. The number of casualties could be as high as 15,300, and direct economic losses might top $40 billion.
In 1976, a magnitude 5.0 earthquake struck Poinsett County, Arkansas.
Illinois
Southern Illinois is near two significant earthquake zones. The most notable is the New Madrid Seismic Zone, which poses a high risk to several states. The second fault zone is the Wabash Valley Seismic Zone, where a magnitude 5.2 earthquake shook the area in April 2008. Prior to that, a 5.3 quake caused some damage in 1968.
A large earthquake in the New Madrid Seismic Zone could have 6,300 casualties and possibly damage 45,000 buildings and 160 bridges. It could have a $44 billion economic impact on the state.
Kentucky
Kentucky is also at risk from the New Madrid Seismic Zone. A large 7.7-magnitude earthquake in the New Madrid Seismic Zone would likely cause a $53 billion economic loss for Kentucky. Among the losses would be damage to 68,400 buildings and 250 bridges. The number of casualties could be 6,900.
Within Kentucky’s borders, the largest recorded earthquake was a magnitude 5.2 that hit on July 27, 1980 in Bath County. The shaking caused an estimated $3 million in damages in Maysville. A smaller 4.2-magnitude tremor shook Perry County in 2012.
Missouri
Missouri is another state that would be severely affected by a major earthquake in the New Madrid Seismic Zone. In fact, the seismic zone is named after the Mississippi River town of New Madrid, which was part of the Louisiana Territory when the 1811 earthquake hit and is now part of Missouri.
A repeat of the 1811 earthquake would likely damage 87,000 buildings and 1,000 bridges. There could be 14,100 casualties, and the state could face $49 billion in direct economic losses.
Because of the below-ground geology of the region, a major earthquake in the New Madrid Seismic Zone could cause destruction over an area 20 times larger than a similar quake in Southern California (Jackson County, Earthquake Threat). It’s estimated that these major quakes occur probably every 200 to 300 years.
A study at the University of Illinois determined that a magnitude 7.7 New Madrid rupture would leave more than 7 million people in the region homeless and would leave large parts of St. Louis, Missouri, and Memphis, Tennessee, uninhabitable. The St. Charles County Division of Emergency Management puts the odds of another major New Madrid quake happening before 2040 at 25 percent.
More information for earthquake preparedness can be found on the Missouri Department of Public Safety, State Emergency Management Agency page for Earthquakes
South Carolina
In the 2014 U.S. Geological Survey Hazards Map, Charleston, South Carolina has a high risk of a damaging earthquake within 50 years. The area was hit by a magnitude 7.0 (or higher) tremor in 1886. A smaller, 5.5-magnitude quake struck near the town of Union in 1913.
Like much of the Midwest and eastern United States, the frequency of large earthquakes in South Carolina is a best guess due to the lack of visible evidence. But increased research is improving estimates. Large ruptures are estimated to occur about every 200 to 250 years, with larger events, like the one in 1886, happening between 250 and 500 years. However, moderate tremors are likely much more frequent, with a probable frequency of about every 125 years.
According to a 2016 HAZUS report released as part of the South Carolina emergency management plan, if South Carolina were to experience a magnitude 7.3 earthquake, more than 4 percent of the buildings would be damaged beyond repair. Among those would be 13 hospitals, 30 fire stations, and two emergency operations centers. Of the 83,961 buildings that would likely experience complete damage, more than half would be single-family homes. The most vulnerable of the structures are unreinforced brick masonry buildings (Expectations for Charleston’s next great unexpected disaster). More than 2,000 bridges would be at least moderately damaged.
Initially, an estimated 166,675 households would be without potable water. A week later, 94,500 would still be without water.
The HAZUS report estimates 213,063 households would be without power, and one month later, more than 53,000 would still be without electricity. Three months later, there would still be 1,341 households without power.
Nearly 94,000 households would be displaced, and 62,464 residents would likely need temporary shelter.
Depending on when the earthquake strikes, a midday tremor would likely result in 2,877 fatalities and leave another 1,553 with life-threatening injuries.
Tennessee
Wednesday, December 12, 2018, a small magnitude 4.4 earthquake shook eastern Tennessee. A 3.3 magnitude aftershock followed. While these were not quakes to worry about, they do provide the reminder that the state has earthquake risk.
Like other midwestern states, Tennessee’s greatest earthquake risk is the New Madrid Seismic Zone. A repeat of the 1811 event would result in major economic losses and thousands of fatalities, including several thousand in Memphis. Like nearby states, tens of thousands of structures would be damaged in the event, and vital infrastructure, such as water supply, would be affected.
Some of the Tennessee-specific impacts of a magnitude 7.7 New Madrid earthquake include:
• 33,000 injuries
• 1,300 deaths
• 710,000 households without power
• 510,000 households without potable water
• 265,000 buildings damaged
• 107,000 buildings completely damaged
• 55 hospitals damaged and unable to provide service
• 250 fires stations and 125 police stations damaged and unable to provide service
• 40 airports damaged and not operational
• 1,000 bridges damaged, with 250 completely unusable
• 50 dams and 7 levees damaged
• 21 million tons of debris requiring 850,000 truckloads to remove
What isn’t really mentioned in the analysis of a possible repeat of the 1811 New Madrid earthquake is how the quake could affect the Mississippi River. It is entirely possible that the series of levees could fail in one or more places, causing the river to invade the spaces civil engineers have tried to protect. Even worse is if the river were at or near flood stage. Water, especially large amounts of it, wants to flow through the path of least resistance. The result of a flood would not only affect Memphis but also have consequences in western Kentucky, southern Missouri, and parts of Arkansas.
Besides the New Madrid Seismic Zone, there is another risk for tremors in Tennessee. Near the eastern border of the state is the lesser-known Southern Appalachian Seismic Zone, which stretches from northeastern Alabama into southwest Virginia and east Tennessee. Most earthquakes in this seismic zone are small, with magnitude 4.6 tremors occurring in 1973 near Knoxville and in 2003 in nearby Fort Payne, Alabama. It’s estimated the seismic zone can produce a magnitude 7.5 rupture, which would be as devastating as an earthquake in the New Madrid Seismic Zone.
Top Earthquake Risk Cities in the U.S.
Since the order of rankings tend to vary from site to site and year to year, but the highest earthquake risk cities tend to remain in the top rankings, the top earthquake risk cities in the U.S. are listed in alphabetical order.
For reference, here's the USGS earthquake hazard map.

Anchorage, Alaska
California usually takes the headlines for earthquakes in the U.S., but Alaska has the highest earthquake risk.
It’s not uncommon to hear about a large earthquake in Alaska. However, since the population density is extremely low, few people are affected, making the event not very newsworthy.
Anchorage has a population of around 300,000. While not as large as some of the other cities mentioned, if an earthquake were to strike the city, considerable damage, injuries, and even fatalities would occur. Most of the negative effects may not come from the earthquake itself but as the result of an earthquake-caused tsunami.
Recent studies of the seafloor off the coast of Alaska, an area called the Shumagin Gap, indicates a subduction zone, with a detached section, similar to the one that caused the 2011 Tōhoku earthquake and tsunami (Alaska at Risk of a Massive Earthquake and Tsunami Similar to Devastating 2011 Japan Event).
Charleston, South Carolina
If you look at the USGS earthquake hazard map, Charleston has a high risk for having a damaging earthquake within 50 years. As one of 16 states that has experienced a magnitude 6.0 or greater earthquake, South Carolina has “a relatively high likelihood” of another damaging quake ('We are the bull's eye').
Charleston was struck by an estimated magnitude 7.0 earthquake in 1886, but evidence is difficult to find. The local faults—the Middleton Place-Summerville Seismic Zone—are buried under thick layers of sand and sediment, which keep the fault lines hidden, unlike the San Andreas Fault, where much of it can be seen on the surface. The seismologists know the faults are there, but it’s harder to determine which are moving and at what rate.
As mentioned in Chapter 7, and evidenced by the 1886 earthquake, Charleston is within the target zone that has the potential for large earthquakes.
Dallas, Texas
While it’s unlikely a true “Big One” will strike, the risk of a damaging earthquake in the Dallas-Fort Worth area is between 2 to 5 percent. With over 6.8 million people in the Dallas-Fort Worth-Arlington area, a lot of people would be at risk if an earthquake were to strike.
For now, the earthquakes are still in the lower-magnitude range, although these can still cause cracks in buildings and knock things over. However, as Rob Williams, the USGS coordinator for the earthquake program in central and eastern United States, stated, “The more small earthquakes you have, the more of a chance [there is] of having a bigger one” (Risk of quakes on the rise in Oklahoma, North Texas).
In July 2019, researchers at the University of Texas at Austin released a study that includes a map of more than 250 faults in the Dallas-Fort Worth area. Together, the faults total more than 1,800 miles of length under the region. The study found the faults to be stable, if left alone, but they are sensitive to changes.
Furthermore, a big part of the increasing seismicity risk in the region comes from induced earthquake risk. As oil and gas operations increased from 2008 to 2015, the seismic activity in the region also went up. As wastewater injection has slowed since 2015, seismic activity has significantly reduced.
The study found that because the fault system is sensitive and can potentially produce earthquakes, any future increase in deep wastewater disposal needs to be managed better.
Honolulu, Hawaii
Being a volcanic hotspot, Hawaii is a top earthquake risk. With the largest population of the islands, Honolulu is the highest risk.
An 1868 magnitude 7.9 earthquake in Honolulu killed 77 people with the resulting tsunami and landslide. With today’s much larger population, a quake of that magnitude poses a greater threat. Since 1868, seven earthquakes of magnitude 6.1 and larger have hit the islands, including a 6.9 that struck in May 2018.
Los Angeles, California
With the nearby San Andreas Fault, stories and movies about the “Big One” laying waste to Southern California are a common theme. While the possibility of California dropping into the ocean may seem like science fiction, the USGS gives the Los Angeles area a 67% probability of at least one magnitude 6.7 or larger earthquake happening by 2037.

Expanding the area beyond Los Angeles, the probability of a magnitude 6.7 earthquake striking Southern California is 97% for that same time period. A magnitude 7.0 earthquake is an 82% probability. Even a magnitude 7.5 has a 37% chance of hitting the region (Forecasting California’s Earthquakes—What Can We Expect in the Next 30 Years?, 2008).
The magnitude 7.1 earthquake on July 5, 2019, certainly fits into the probability, and it has refueled anxieties and fears about a Big One on the San Andreas Fault.
Memphis, Tennessee
New York City, New York
Oklahoma City, Oklahoma

Portland, Oregon
San Francisco, California


Comments
Post a Comment